Adapty updates9 min read
How to run profitable ads for subscription apps?
At the median subscription app, only 3 of every 100 installs become paying subscribers. Here's how to find profitable ads for subscription apps.

Dalibor Vasic
ReadAt the median subscription app, only 3 of every 100 installs become paying subscribers. Here's how to find profitable ads for subscription apps.
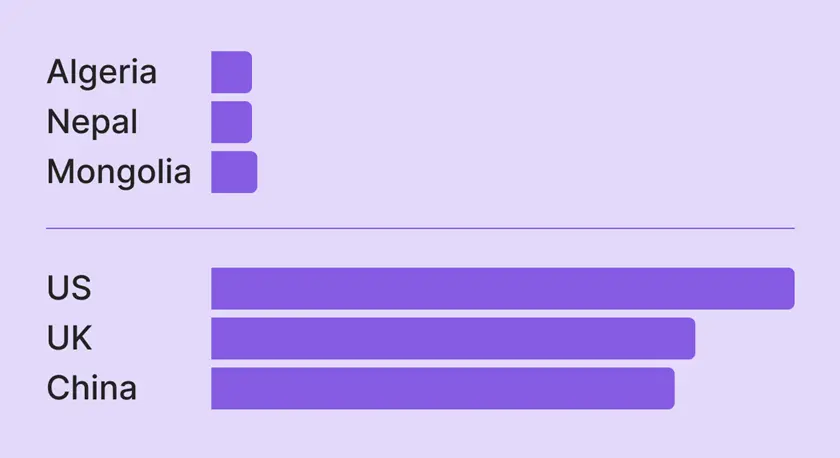
A tap in the US costs 14× more than in Algeria. But cheap taps don't make a market worth entering. The 2026 data on which countries actually pay back.

Apple Ads CPA hides two levers: cost per tap and conversion rate. Use this 2026 diagnostic from 8,000 apps to find which one is broken and fix it.
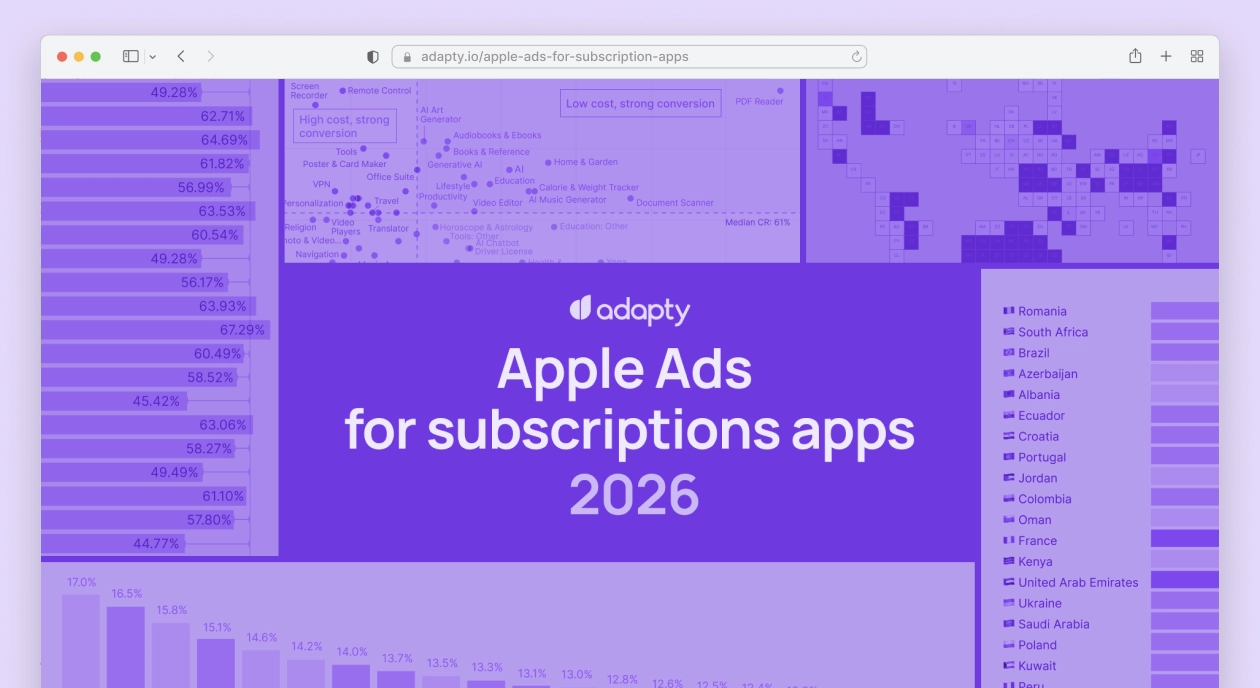
Read about key Apple Ads benchmarks such as average cost, CPT, CPA, and more across 90 countries and 59 categories.
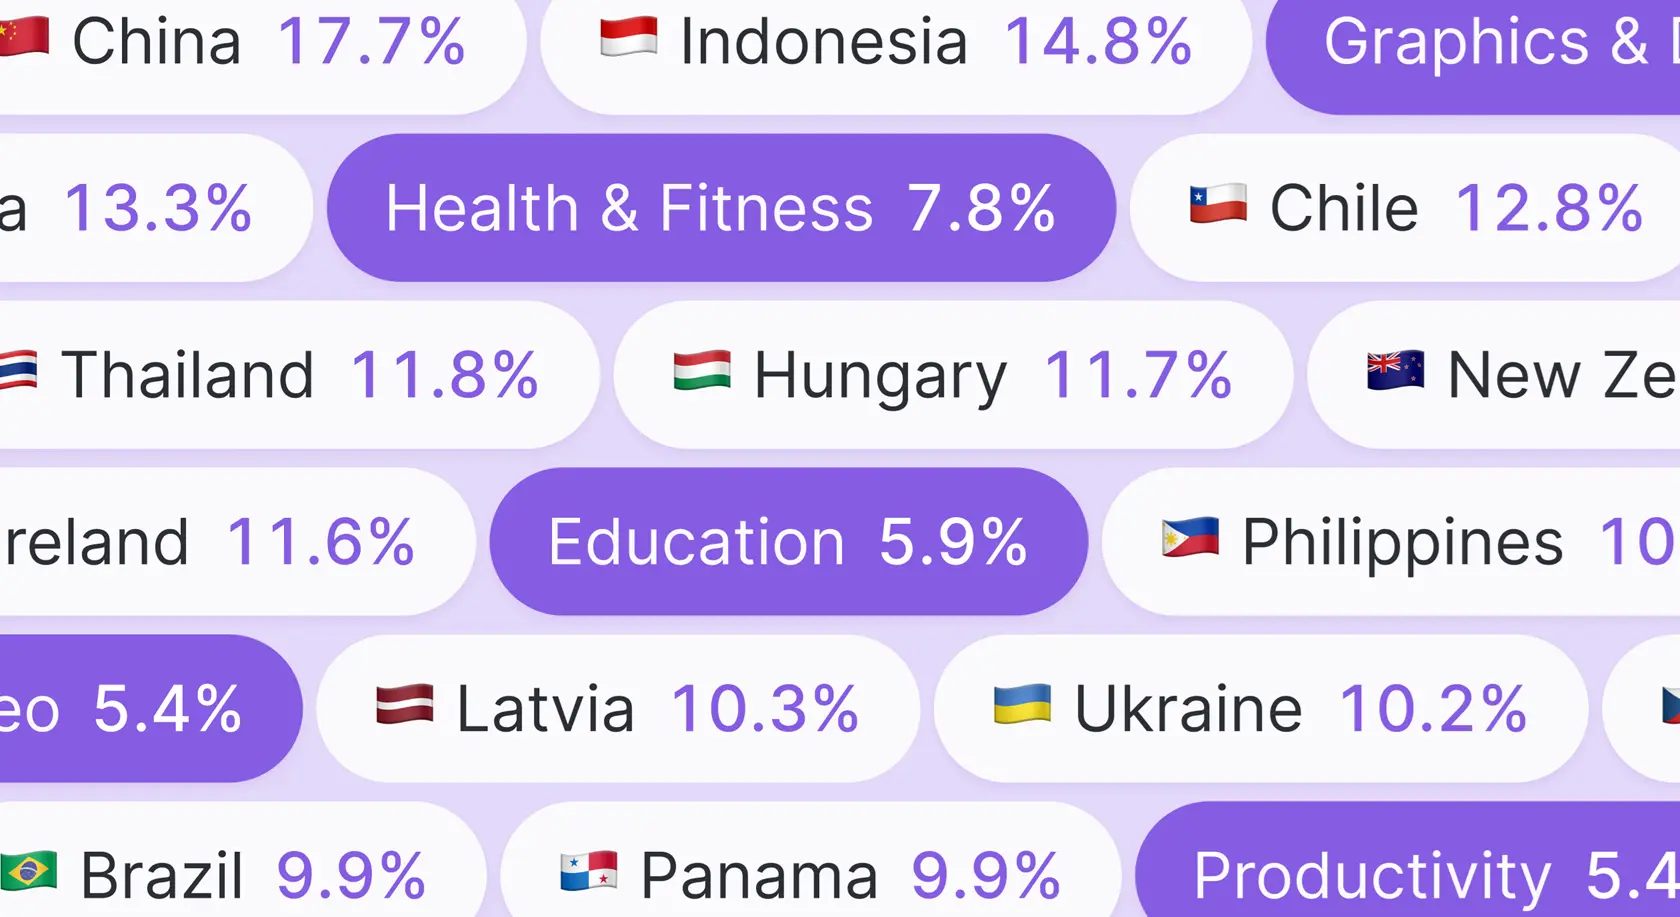
Apple Ads converts installs to paid at 1.92%, 2.1× better than other paid channels. Check 2026 benchmarks by country and category, and how to read yours.
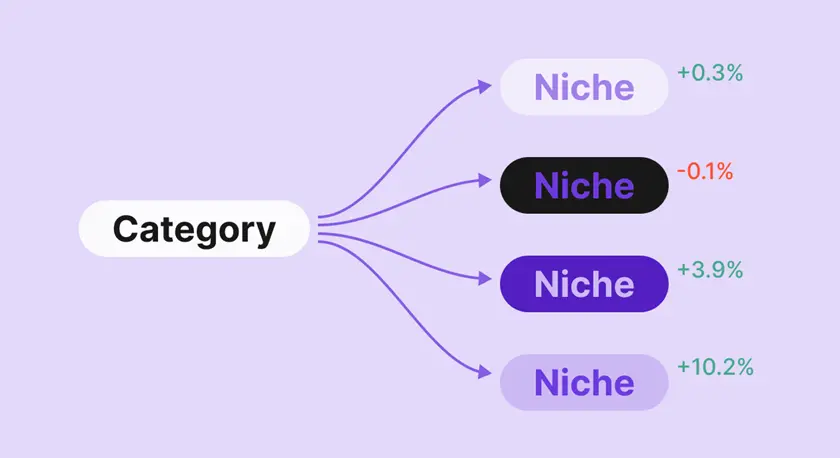
Two apps in one App Store category can differ by 12.7× in CPA. See Apple Ads benchmarks by niche to learn what to benchmark against instead.
The subscription growth newsletter
How to run profitable ads for subscription apps?
Cheapest and most expensive countries for Apple Ads in 2026 (and why cheap isn't always better)
How to lower Apple Ads CPA: diagnostic guide for 2026
Apple Ads benchmarks 2026: CPT, TTR, CPA, and more across 90 countries
The subscription growth newsletter
Monthly tactics, benchmarks and paywall insights — straight to your inbox
Your monthly payout summary
Security alert digest
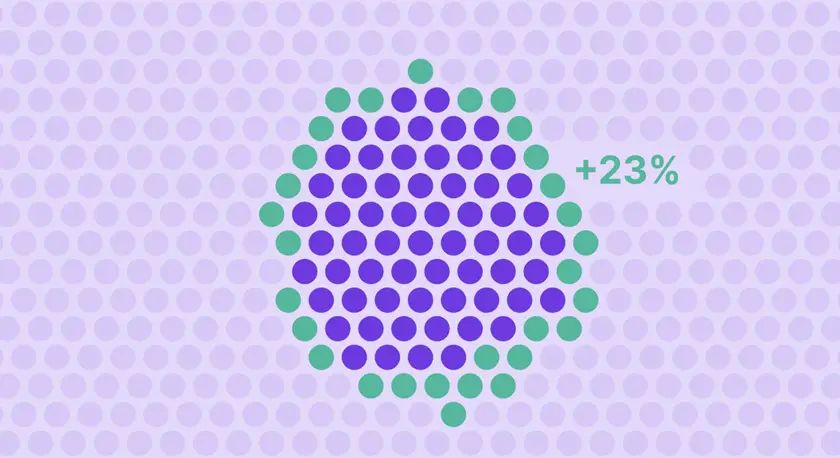
Custom Product Pages lift Apple Ads downloads 23% on the same spend. The 2026 data on how CPPs work, when they don't, and how to set them up.
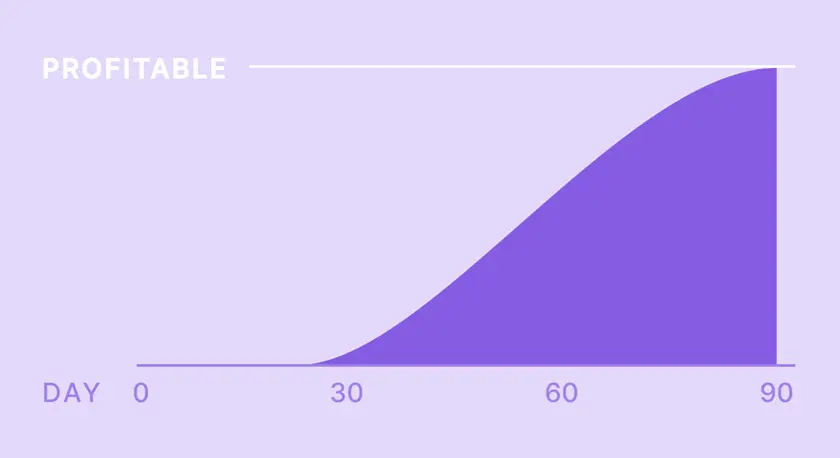
Apple Ads profitability isn't a fixed number of days. Check data on what drives payback, why teams kill campaigns too early, and how to shorten it.
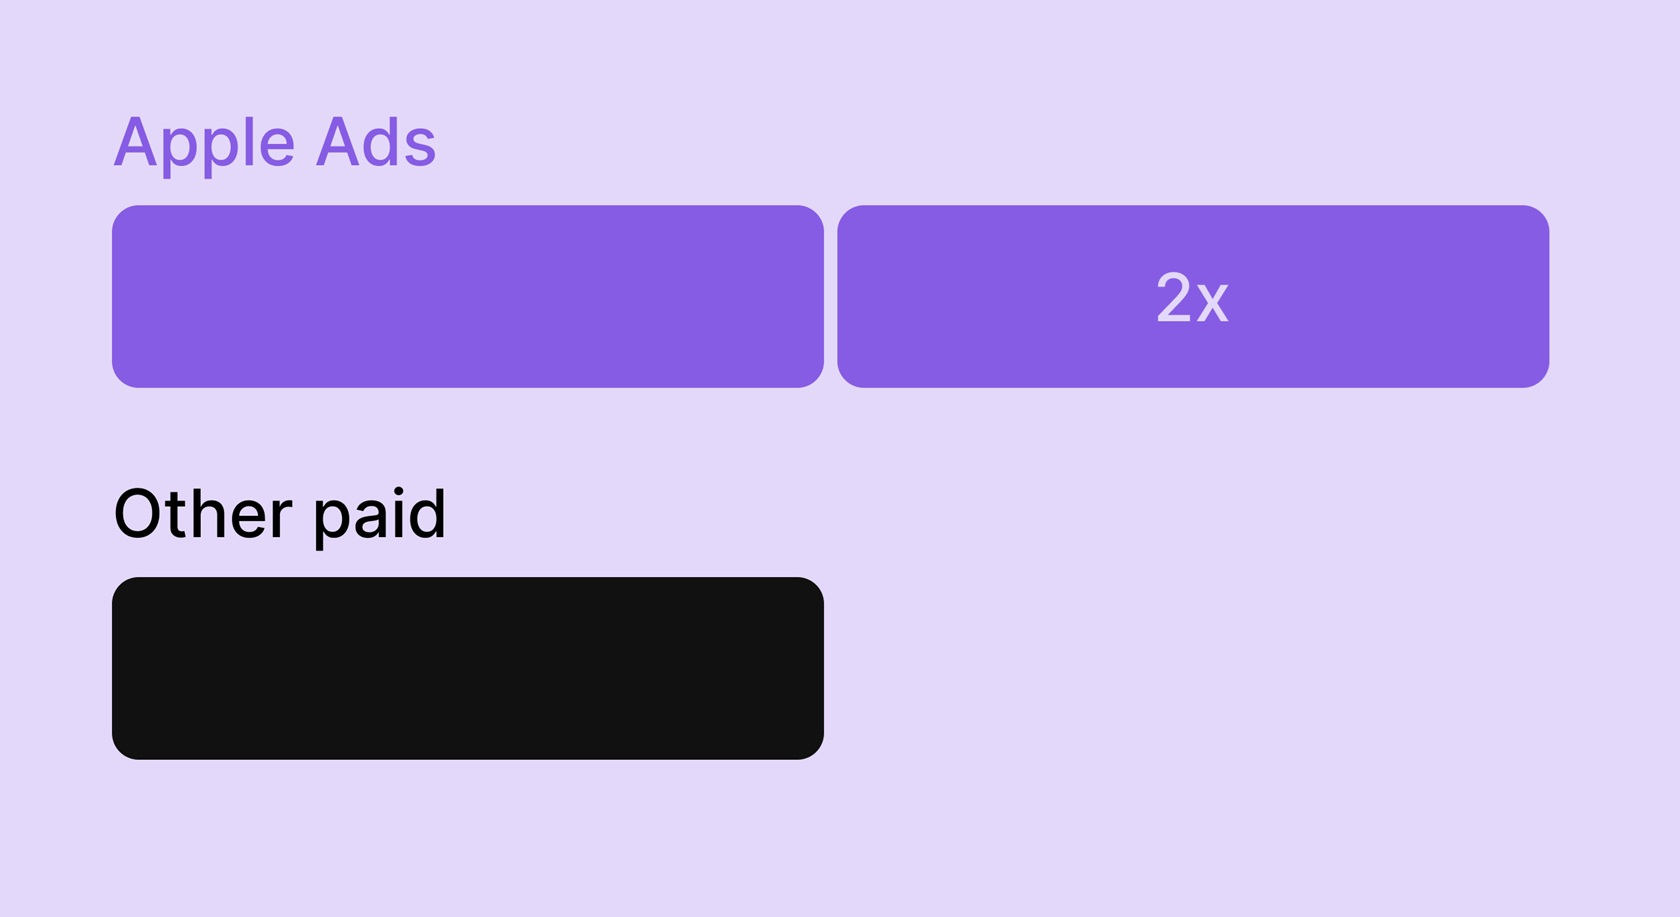
Apple Ads converts 2.1× better than other paid channels, but it can't scale like Meta. See when to use Apple Ads, Google, and Meta, and how to split budgets.

Utilities apps lead all categories in 12-month trial LTV. Full 2026 benchmarks on pricing, trials, plan type, and regional data from $3B in subscription revenue.


Benchmarks for Photo & Video app subscriptions — LTV, pricing, refund rates, conversion, and paywall strategy. Based on $3B in revenue across 16,000+ apps.

Graphics & Design direct buyers out-earn trial users, and AI apps in the category grew 202% YoY.